A summer project?
I first noticed the positron lab during a lab tour in my third-year LASER and modern optics course. This lab is doing cutting-edge research on positronium, i.e., a positron and an electron.
The lab employs a sodium-22 source to produce positron, a porous silicon target for the positron to positronium convention, LASERs to excite the electron to Rydberg state, and so on. I was fascinated by the complexity of the whole setup and the precision of the measurements. This motivates me to dive deep into this area and obtain some research experience inside a group.
For more information, please visit David’s group website.
Outcomes
-
Get acquainted with the equipment used in the continuous beam and analyze data obtained from the position-sensitive detector.
The positroniums are formed via a Xenon gas cell. The following is a deflection plate which is used to separate positrons and positroniums. After that, there are two waveguides which set up the SOF. Grids (conducting mesh) are used to confine the Radiofrequency field (RF field), while also causing the positroniums to break up, i.e. forming pairs of positron and electron. Even though there is voltage configuration on the plates before the multichannel plate (MCP), it’s hard to select positronium alone. The following is some investigation on separating the noise from the signal using Bayesian and assuming that the noise and signal are Gaussian distributed.
In the positronium spectroscopy experiment, the primary observable is the count rate of detected surviving positronium particles after they traverse a series of complex fields, based on Ramsey’s method. To capture this data, a positron-sensitive detector is employed, with a multi-channel plate (MCP) placed in front of it to amplify the signal. The MCP essentially consists of a plate housing multiple photomultipliers, which can also detect electrons, positrons, and other charged particles in addition to positronium.
The typical readout from the position-sensitive detector provides information on the x and y positions along with the corresponding count for each point. Examining this image, it is evident that there is a central circular region with higher counts, surrounded by a background. Given our understanding of the equipment, it is reasonable to surmise that the central region corresponds to positrons breaking up on the grids of the waveguide. Conversely, the background represents the positronium signal, which is the variable of interest for measurement.
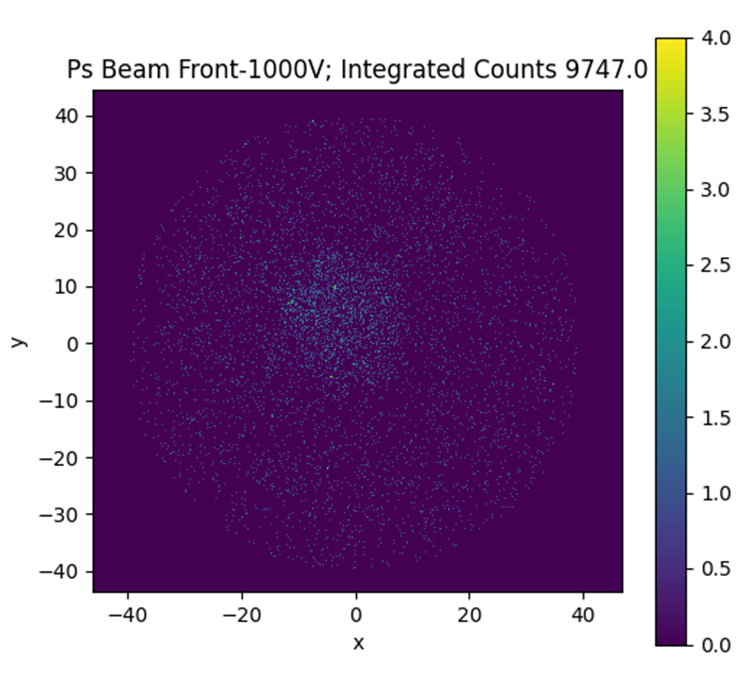
One might propose excluding all data points within the circular region as they likely contribute to systematic errors, akin to the highlighted red circle shown below. One might propose excluding all data points within the circular region as they likely contribute to systematic errors, akin to the highlighted red circle shown below.
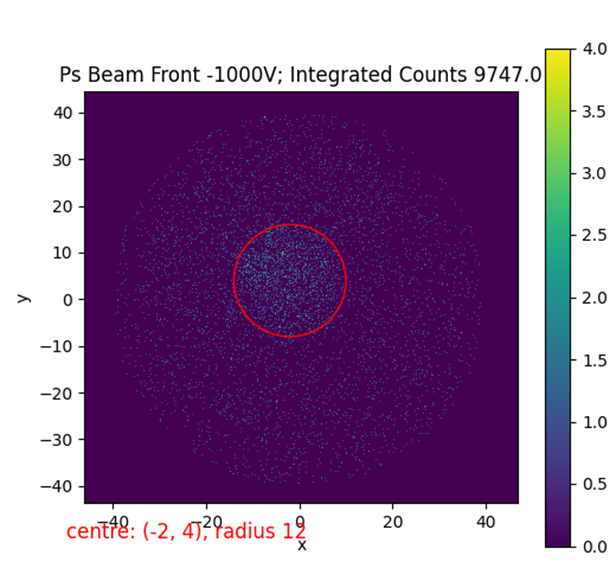
Indeed, the red circular region combines the positronium count rate with other sources of errors. However, directly subtracting an overall mean of error may not be ideal, as not every individual pixel may have a count, potentially resulting in negative values. Additionally, it’s advantageous to retain a larger count to minimize errors, especially considering the low survival rate of positronium under the current experimental setup. Gathering sufficient data for a statistically robust result can be time-consuming.
To preserve as much data as possible, Bayes’ theorem is employed. The following image aggregates data from the detector into a histogram, plotting count rates (i.e., counts over measurement time) against the number of events.
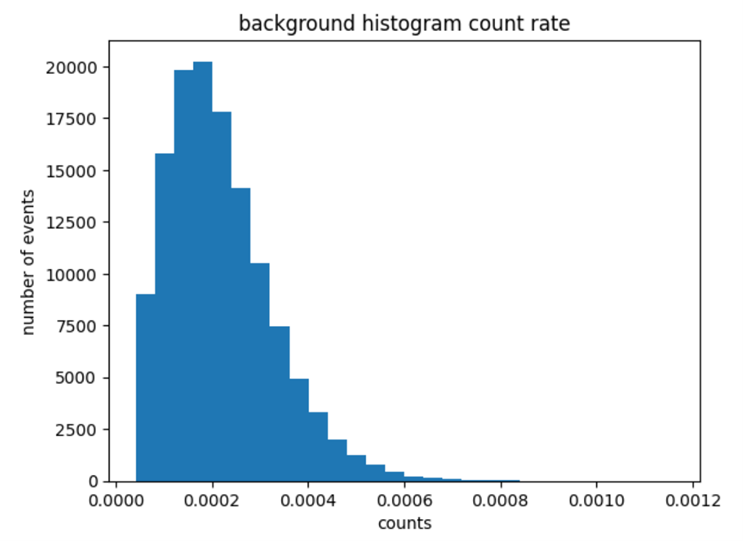
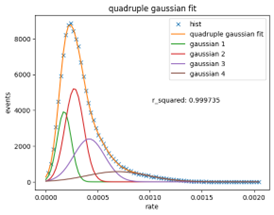
In statistics, different sources that give a signal on the position sensitive detector can be assumed to be a random variable which follows Gaussian distribution. That is fitting multiple Gaussian to the histogram. Based on r squared, the quadruple Gaussian fit best describes the data.
Applying Bayes’ theorem allows the establishment of the following relationships:

By considering Gaussian 3 and 4 as noise components, it is possible to effectively isolate the count rate attributable to noise from the genuine signal. This process reveals a spiral-like noise region, as depicted in the following image. This approach is advantageous because it calculates the expected noise count rate, accommodating cases where adjacent pixels yield zero readings.
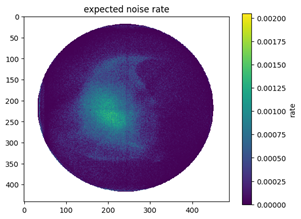
Subtracting the overall count rate from the expected noise rate yields the following image, which represents the anticipated signal emanating from positronium. However, a noticeable spiral region still lacks signal. It becomes evident that this straightforward approach falls short.
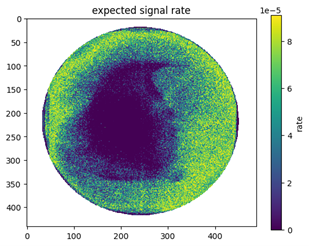
Future work and improvements should involve exploring alternative methods, particularly for handling distributions other than Gaussian. Gaussian distributions can yield negative values, whereas the position-sensitive detector’s readings are constrained to non-negative integers. Consequently, applying a zero cutoff for a Gaussian distribution does not accurately model random variables restricted to zero and positive integers.
-
Investigate the Separated Oscillatory Fields (SOF) technique and perform simulations on positronium.
I’m impressed by how simulations can contribute to our understanding of experiments, particularly in two significant ways.
The first involves assisting in the development of experimental apparatus and fine-tuning of experimental parameters. In the context of measuring the transition frequency of 2P and 2S states of positronium, Ramsey’s Separated Oscillatory Field technique is adapted, with adjustments made to the decay lifetime of the transition states. Theoretical simulations provide insights into the survival probability of positronium following exposure to these fields. By combining this theoretical understanding with prior knowledge about the distribution of positronium sources and other experimental details, it becomes possible to predict the count distribution observed on the position-sensitive detector.
The second application lies in the identification and comprehension of sources of systematic errors. Don, a postdoctoral in David’s group, conducted simulations of the electric field within the vacuum chamber, spanning from positronium production to detection. Surprisingly, the resulting electric field exhibited an attractive force on positrons toward the detector. This simulation may explain the presence of the spiral-shaped central region mentioned earlier.
Summary
Although it’s a relatively short project, I’ve come to the realization that pursuing research immediately after completing my bachelor’s degree requires more capabilities and learning than I currently possess. My undergraduate courses have provided me with valuable insights into positronium’s behavior under the influence of Stark and Zeeman effects, as well as the intricacies of lifetime mixing in its excited states. To achieve precise measurements of the excited positronium state’s lifetime, I have studied the Ramsey’s method. However, it is worth noting that the decay lifetime of 2S and 2P states of positronium plays a crucial role in the detection process, because 2P states have a lifetime around 3.2 ns, which is hard to reach the position sensitive detector. At the time of writing, I am looking forward to the results of the experiment, which will be published in the near future.
In research, meticulousness and perseverance play crucial roles, as encountering mistakes is inevitable throughout the process. Many hours will be wasted and data will become availed if there is a system not turned on. Long days could be spent on adding new setup to the experiment as you will need to bring the system back to atmosphere and then pump to vacuum.
Some thoughts
In university, you will find that some knowledge learned in high school is wrong.
The atomic clock uses the oscillation of atoms. Instead, it uses Ramsey interferometry.
CATMIN III
CATMIN III is a conference about Rydberg states held at UCL this year. I was lucky to attend this conference to investigate Rydberg states atoms, molecules and so on. It’s difficult to dive deep into every single seminar as it covers a wide range of topics, including quantum computation, ultra long range Rydberg atoms using Strontium, and Rydberg atoms in tweezer arrays.
“H atom is a fake positronium atom” (David Cassidy, 12th July 2023)
Some Records
Acknowledgement
Thank you for taking the time to read my post, and I extend my gratitude to all the researchers from David’s group.
If you have any inquiries or would like to discuss anything related to this post, please feel free to reach out to me at zcapwaa[at]ucl.ac.uk.